
Where do you stand on 2027 ?
Belgian power for delivery in 2027 closed at €129,30/MWh on Friday 18 September 2026, 47% above this year’s average. Gas for 2027 closed 71% above its own. Three positions, three next steps, and none of them is waiting.
€495.750 a year
The cost of waiting so far · 15 GWh portfolio, half power half gas · Friday’s close vs the 2026 averages
Sites 5 to 30 GWh · Market data closes of Friday 18 Sep 2026 · Belgium
Situation 1
Nothing signed for 2027
€495.750
per year · 15 GWh portfolio (50% power, 50% gas) · €310.875 on power, €184.875 on gas
That already happened. The rest of the position is the open question: two days to an agreement, one week to tender, three weeks to contract.
Situation 2
Supply contract signed, price not yet fixed
€80.175
IN TWO WEEKS · POWER CAL 2027 MOVED UP €10,69/MWH
2027 is contracted and the click options are unused. Waiting is also a position. What is missing is a stop-loss ceiling, a floor and the rule that executes.
Situation 3
Looking at 2029 and 2030
€84,43
/MWh · power calendar 2029 · against €129,30 for 2027
The near years are covered. Calendar 2029 becomes the second year ahead within months. The window is finite.
Why AYA
Why call us instead of calling your supplier
Getting a quote from an energy supplier is easy. Getting the right energy contract for your business is not. A supplier wants to sell you energy. We look at what that contract costs you when your production changes, when prices move and when reality turns out different from the forecast. That is where the expensive mistakes happen.
01
An offer tells you the price. It does not tell you the moment.
The offer lands on your desk. The formula looks reasonable, the fee is in line. But is this a good week to fix, or the worst one this year? Nothing in that document answers it. Prices move on storage, weather, geopolitics and demand, and what drove this market last winter has little to do with what drives it now. Every Monday you get the level and the reason behind it, so a decision worth more than a million euros a year is not to be taken blind.02
Offers are cheaper and you should benefit, however the cheapest offer can become the most expensive contract
Supplier margins have been significantly reduced (up to 80%) since the start of the year. At every moment, we know what margin is market conform for your consumption profile.
Nevertheless, you can ask four suppliers for a price, compare the formulas, and still sign the wrong contract. What happens when your production drops, when a line shuts down for maintenance, when you inject solar power into the grid, when your real consumption differs from the volume you contracted? We negotiate the terms behind the price: payment conditions, volume flexibility, deviations, hedging options, injection, settlement and other options you keep during the contract.
03
Your 9,6 GWh does not exist evenly across the year
On paper you consume 9,6 GWh. Your plant does not. Production peaks, shutdowns, maintenance, a line that runs three shifts one month and barely runs the next. Fix the whole annual volume without that reality and you pay for energy you never consume, and the contract decides how painful selling it back becomes. The same 9,6 GWh: one contract leaves you selling back 10% of your position, another 3%. Same company, same annual consumption, very different outcome.
04
Signing the contract does not remove the risk
The supplier has your signature, procurement has a negotiated price, the file is closed. Your exposure is not. Prices keep moving, your consumption changes, production plans change, and a contract that looked right on the day you signed it can fit poorly six months later. We stay involved for the full term and review your position and forecast with you, at least four times a year: what has changed, what the market is doing, and whether your clicking strategy still makes sense.
05
Your bill moves on more than the market price
A change in network tariffs, carbon costs, regulation or the rules for flexibility and imbalance can affect your energy bill as much as a market movement. These costs are not set on the energy market, and a price comparison does not show them. We follow them, calculate what they mean for your consumption profile and discuss them with you before they reach your invoice.
05
The question is not what advice costs, but what it returns
That return does not come from the energy price alone. It comes from a lower supplier margin, better contract terms, less exposure to volume deviations and imbalance, disciplined buying decisions and risks identified before they become costs.
Our objective: the value we create or protect for your business is higher than the cost of our support. In the first conversation we make that calculation with you, for your own contract.
Your energy contract is not a commodity purchase. It is a financial decision sitting underneath your production.
Thirty minutes on your contract, your click options and your horizon. No obligation.
The market, close of Friday 18 September 2026
€129,30/MWh
Belgian power, calendar 2027. Year average €87,85/MWh.
€59,32/MWh
TTF gas, calendar 2027. 71% above its year average; gas sets the power price.
69,3%
EU gas storage on 18 September. Five-year average near 79%.
€84,43/MWh
Belgian power, calendar 2029. 34,7% below 2027.
AYA Market Update / EnergyMarketPrice, closes of Friday 18/09/2026 · storage: EU fill level, 18/09/2026
69,3%
EU gas storage on 18 September. In the past four years, storage was between 81% and 94% full Europe fills at winter prices.
October
Qatar’s force majeure on LNG runs through the month. Asia pays more for the same cargo: JKM above TTF.
Redirectable
Europe swapped pipeline gas for cargoes that can change destination in a day. Geopolitics now drive the 2027 price.
52,7
Eurozone manufacturing PMI in August, final figure published on 1 September. Above 50 means industry is growing. More output means more gas demand.
The guide
Four pages.
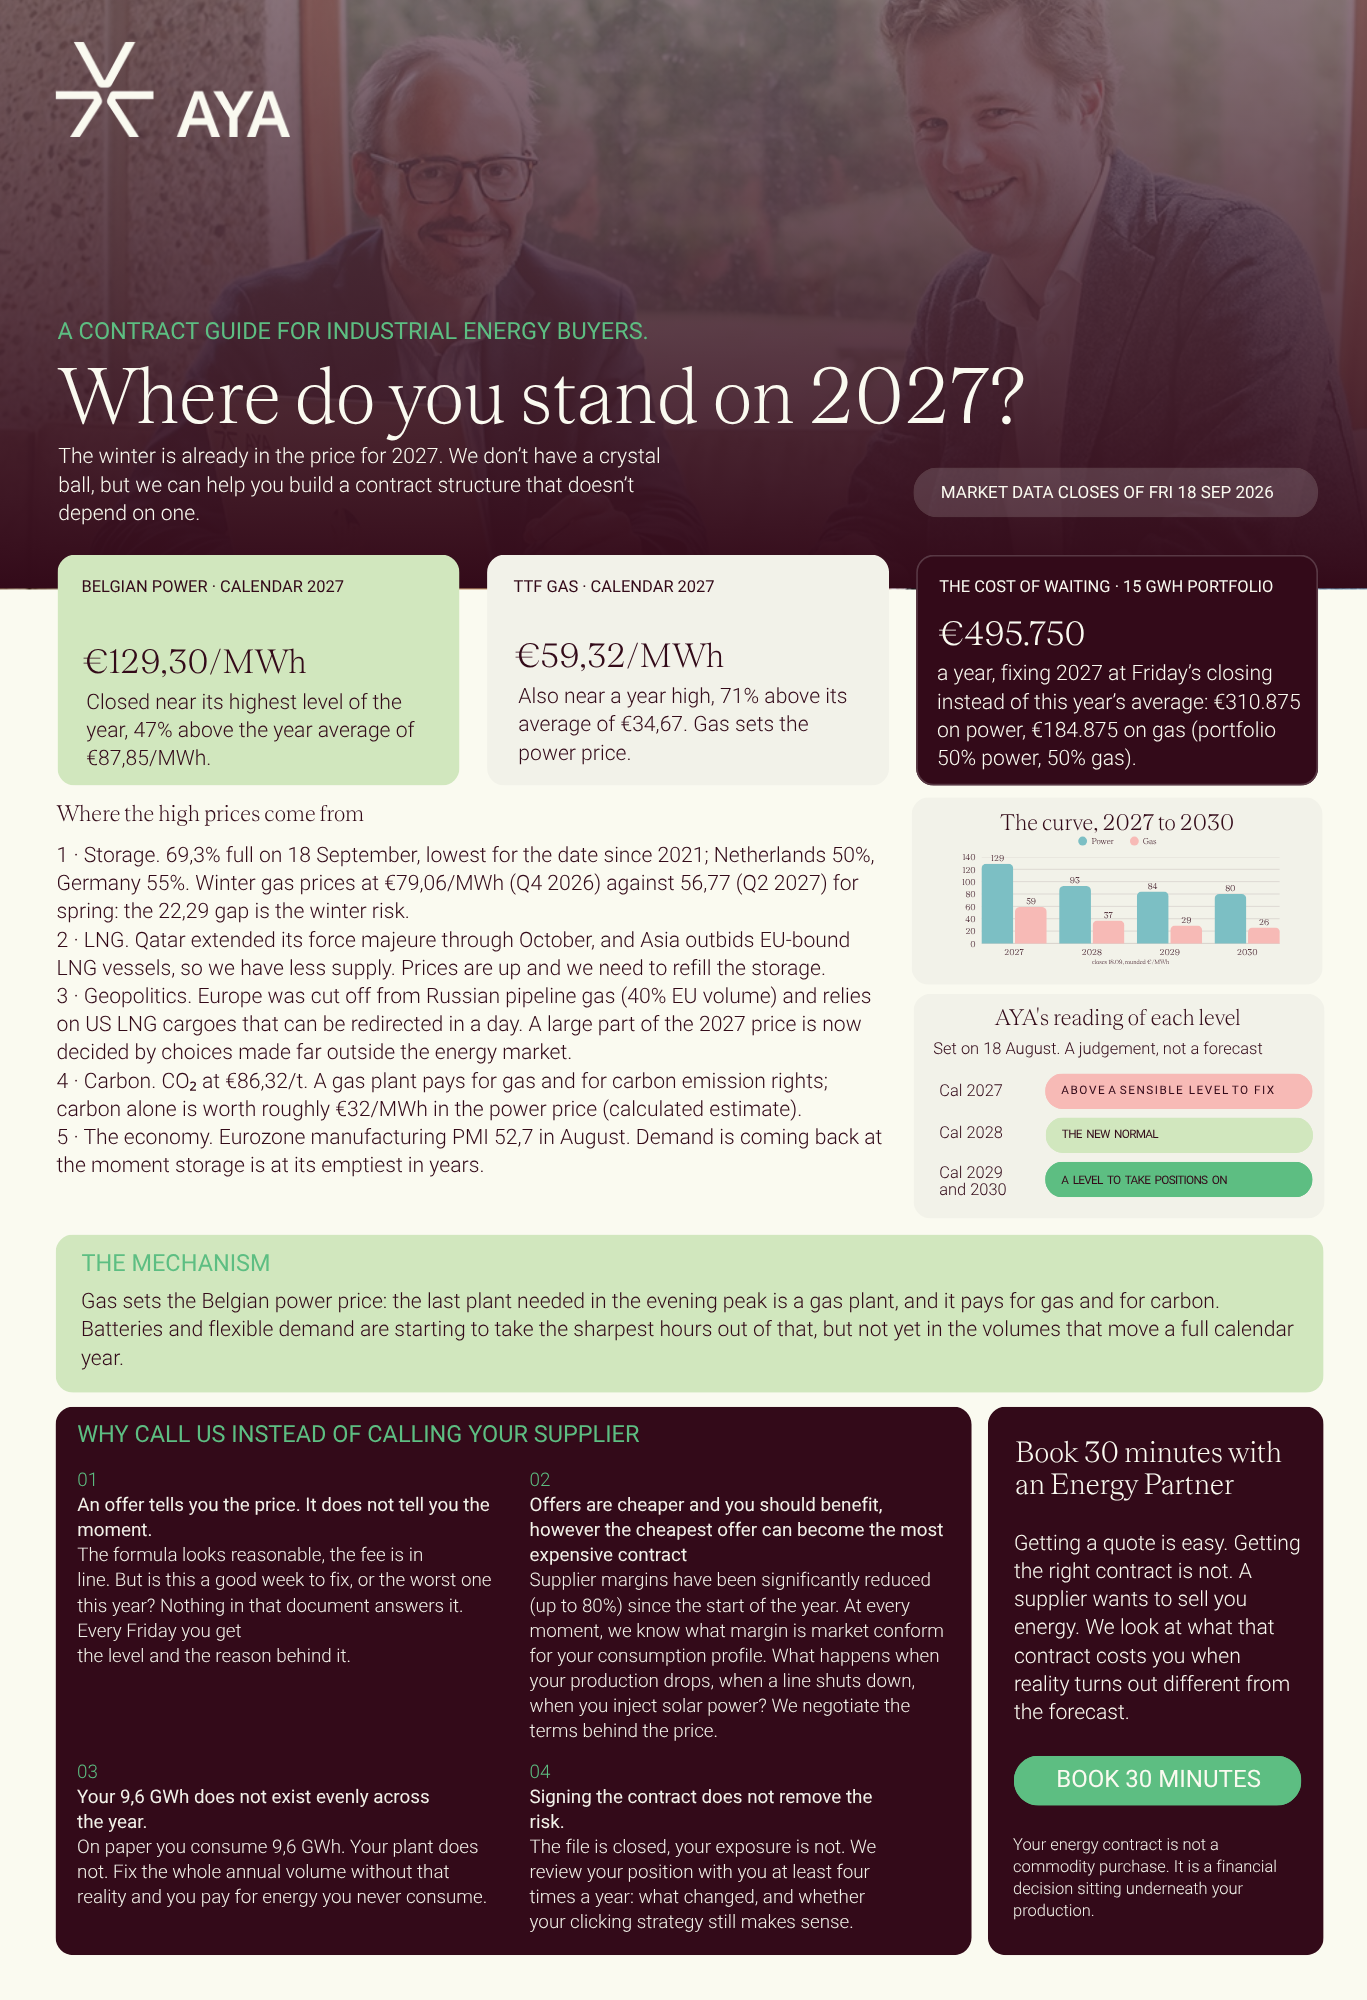
Where do you stand on 2027? A contract guide for industrial energy buyers
The market as of 18 September, and three situations with what each one costs, three ways to buy, and the next thirty days.
- The curve 2027 to 2030, power and gas, with AYA’s reading of each level
- The rule that makes a ceiling (cap) and a floor execute
- The contract clause a battery site needs before the supply contract is signed
Get the guide
Four pages, PDF, straight to your inbox.
You receive the PDF by mail. An Energy Partner follows up within five working days.
Three ways to buy
The method follows your risk mandate, not the market
Every situation in the guide ends in one of these three. The guide says which fits which situation.
01
Spread purchase
Fixed click moments, for example one fiftieth of the volume every week. The price tracks the market average. No timing risk, no timing gain.
02
Spread with thresholds
A cap and a floor set upfront. If either is reached, a click executes. If neither is reached, the click executes at the end of the period at market price.
03
All at once
The whole volume fixed in one decision, at one price. Simple, and final. At today’s levels it means fixing at the year’s high.
energy managers
TWh
electricity under management
TWh
gas under management
years of market experience
MW
flexibility in the pipeline
Book 30 minutes with an Energy Partner
Thirty minutes on your contract, your click options and your horizon. No obligation.
We model, we roll out, we operate. So your energy stays in control.
Every figure on this page, with its calculation and its source
| Figure | Calculation | Source |
|---|---|---|
| €495.750 a year | (129,30 − 87,85) × 7.500 + (59,32 − 34,67) × 7.500 | A 15 GWh portfolio, half power half gas. Each close minus its own 2026 average, on one year of volume: €310.875 on power, €184.875 on gas. |
| €80.175 in two weeks | €(129,30 − 118,61)/MWh × 7.500 MWh | Closes of Fri 04/09 and Fri 18/09/2026, power calendar 2027, on the power half. |
| €129,30/MWh · +47% | 129,30 / 87,85 − 1 | Belgian baseload power, calendar 2027, close 18/09. |
| €59,32/MWh · +71% | 59,32 / 34,67 − 1 | TTF gas, calendar 2027, close 18/09. |
| €84,43/MWh · 34,7% below | 1 − 84,43 / 129,30 | Power calendar 2029 against calendar 2027. |
| €86,32/t · ≈ €32/MWh | 86,32 × 0,37 t CO₂/MWh | EUA close 18/09. The €/MWh figure is an estimate for a gas plant. |
| 52,7 PMI | Index level, above 50 means expansion | Eurozone manufacturing PMI in August, final figure published on 1 September. Above 50 means industry is growing. |
| 15 GWh a year | 7.500 MWh power + 7.500 MWh gas | Reference portfolio for a mid-size industrial site. |
| 10% and 3% sold back | Same 9,6 GWh, flat 1,1 MW vs 0,7 + 0,8 MW | AYA webinar decks 13/11/2025, 16/12/2025 and 31/03/2026. |
Read more

Demand Flexibility Service saves over 3.3GWh of electric
The UK's National Grid ESO Demand Flexibility Service (DFS) has saved over 3.3GWh of electricity during peak times over the winter of 2022/23. The scheme, which had 22 service events and was open from 1 November 2022 to 31 March 2023, saw 1.6 million households and...

We reduce the impact of your energy consumption on your bottom line and the planet
At AYA, we provide a unique, coherent approach for energy-intensive industries in Europe. 'Those who do not embrace the green and sustainable energy transition will quite literally face the financial consequences. During the energy crisis, the energy market has...
